
Oscilloscope
What an oscilloscope is and how to use it: the parts of the FNIRSI-1014D, the probe, the trigger, reading the screen and an Arduino PWM signal.
What is an oscilloscope?
An oscilloscope is an instrument that draws how a voltage changes over time. On its screen, time goes from left to right and voltage goes up and down. When the voltage doesn’t change, the oscilloscope draws a flat line. When it changes, it draws a curve.
A multimeter shows one number: what the voltage is now. An oscilloscope shows the whole story: what the voltage was a moment ago and how it changed. It’s like the machine in a hospital that draws your heartbeat: from the drawing, the doctor sees how the heart works, not just how many times it beat.
An oscilloscope is very fast. Ours measures the voltage a billion times a second, so it sees even changes that last a millionth of a second. That’s why we use it to look at things that are too fast for a multimeter and for our eyes: an LED that switches on and off hundreds of times a second, the data an Arduino sends to another device, or a key that the program checks thousands of times a second.
Our oscilloscope: the FNIRSI-1014D
In the workshop we have one oscilloscope, the FNIRSI-1014D. It has two channels, so it draws two voltages at the same time, and a built-in signal generator. The leader works with it, and the participants watch and help.
| Property | FNIRSI-1014D |
|---|---|
| Channels | 2: CH1 (yellow) and CH2 (blue) |
| Bandwidth: how fast a signal it still draws correctly | 100 MHz per channel with the probe on 10X, about 5 MHz with the probe on 1X |
| Sampling | 1 GSa/s: a billion measurements a second |
| Screen | 7 inches, 800 × 480 pixels |
| Input voltage | up to 40 V peak to peak with the probe on 1X, up to 400 V with the probe on 10X |
| Trigger | Auto, Normal and Single; rising or falling edge |
| Measurements | up to six values next to the trace (buttons F1 to F6), cursors for time and voltage, FFT |
| Memory | up to 1000 screenshots and 1000 recorded signals, copied to a computer with a USB cable |
| Signal generator | 14 waveforms, 2.5 V peak to peak, frequency in steps of 1 Hz |
The figures are from the maker’s user manual.
The parts of the oscilloscope
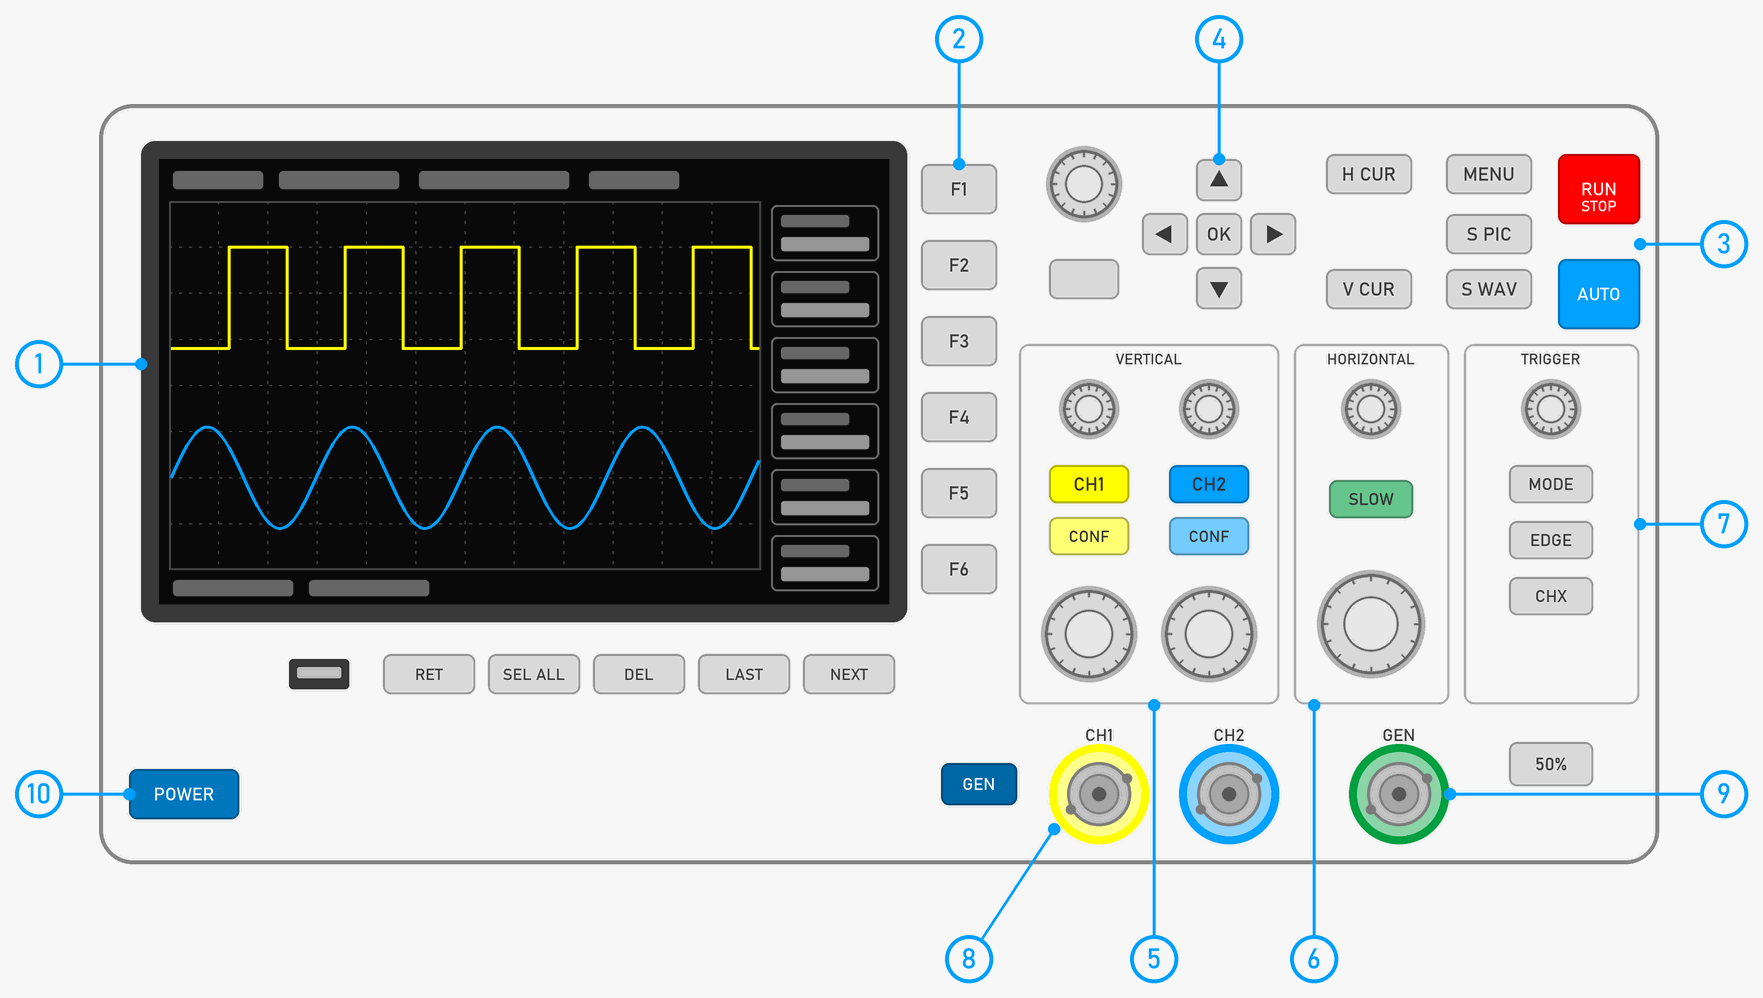
- The screen draws the traces and shows the settings and measurements. How to read it is explained below.
- Buttons F1 to F6 choose what the oscilloscope measures and shows in the column on the right of the screen, for example the frequency or the highest voltage.
- RUN/STOP (red) freezes the picture on the screen and starts it again. AUTO (blue) sets up the oscilloscope by itself so that the signal is easy to see.
- The knob, the arrows and OK move around the menus, and MENU opens the menu. H CUR and V CUR switch on the cursors, lines for measuring time and voltage. S PIC saves a screenshot, and S WAV a recorded signal.
- VERTICAL: for each channel, the CH1 or CH2 button switches its trace on or off, and CONF opens the channel’s settings. The small knob moves the trace up and down. The big one makes it bigger or smaller: it chooses how many volts one square is worth.
- HORIZONTAL: the small knob moves the traces left and right, and the big one chooses how much time one square is worth. SLOW chooses whether the knobs move the trace fast or slowly, for fine adjustment.
- TRIGGER: the knob sets the trigger level, MODE chooses the mode (Auto, Normal or Single), EDGE the rising or falling edge, and CHX the channel. 50% sets the trigger level by itself. What the trigger is, is explained below.
- Inputs CH1 and CH2 are the sockets for the probes. The yellow ring is channel 1, and the blue one channel 2.
- Signal generator: the GEN button opens its settings, and the signal comes out of the socket with the green ring.
- POWER switches the oscilloscope on and off. Here there’s also a USB socket for copying pictures to a computer, and the RET, SEL ALL, DEL, LAST and NEXT buttons for looking through saved pictures.
The probe
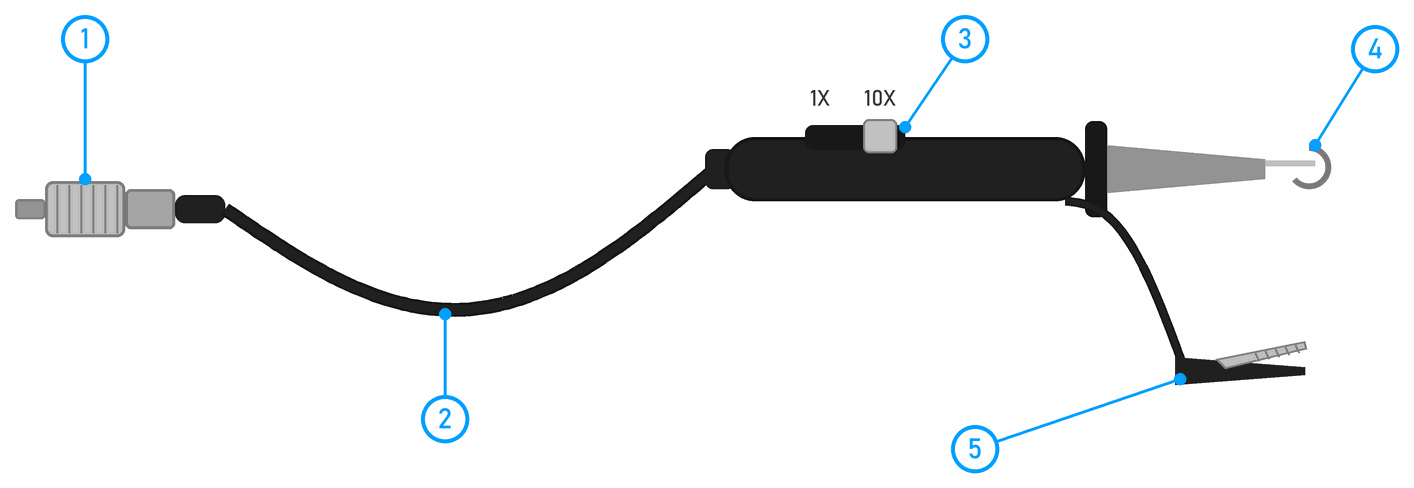
The oscilloscope is connected to a circuit with probes. Each probe has:
- A BNC plug: we push it into the CH1 or CH2 input and turn it clockwise, so that it locks.
- A cable.
- A 1X/10X switch on the handle. On 10X, the probe makes the voltage ten times smaller, and the oscilloscope multiplies it back, if we tell it to. The switch on the probe and the setting in the oscilloscope must be the same, otherwise all the measurements are ten times wrong.
- A tip with a hook. When you pull back the cap of the tip, a hook comes out of it that grips a wire or a leg. Under the cap there’s a sharp needle.
- A crocodile clip for ground. It goes on the circuit’s GND.
How to read the screen
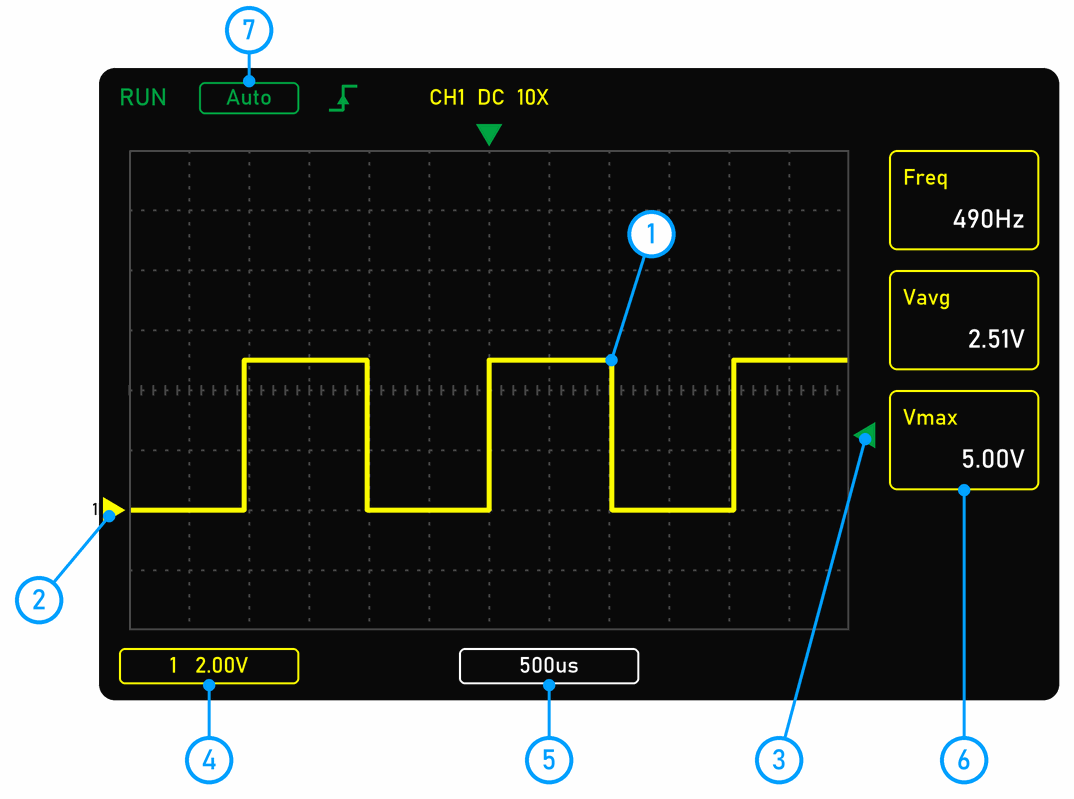
The screen is divided by a grid into squares, called divisions. The picture shows the signal from pin D9 of an Arduino Uno, while the program runs analogWrite(9, 128).
- The trace of channel 1. It’s yellow, like the ring of its input.
- The zero arrow: that’s where 0 V of this channel is.
- The trigger arrows: the green arrow on the right shows the trigger level, and the one at the top the moment of the trigger.
- Volts per division, here 2.00 V. One square up is 2 V.
- Time per division, here 500 µs (us on the screen). One square to the right is 500 microseconds, half a millisecond.
- Measurements: the frequency (Freq), the average voltage (Vavg) and the highest voltage (Vmax). We choose what is measured here with buttons F1 to F6.
- Status: RUN while the oscilloscope is drawing, STOP when we’ve stopped it, the trigger mode (Auto) and the trigger edge.
Once we know what one square is worth, we read voltage and time by counting squares. The top level of this trace is 2.5 squares above the zero arrow, and that’s 2.5 × 2 V = 5 V.
How to use it
- Plug in the oscilloscope’s adapter and switch it on with the POWER button.
- Plug the probe into the CH1 input: push the BNC plug in and turn it clockwise.
- Set the switch on the probe to 10X. Then press CONF below the CH1 button and choose the 10X probe with the arrows. After it’s switched on, the oscilloscope is always on 1X.
- Clip the ground clip onto the circuit’s GND, and the hook onto the point you’re measuring.
- Press AUTO. The oscilloscope sets the volts and time per division and the trigger by itself.
- If the trace is too short or too tall, turn the big knob in the VERTICAL frame. If it’s squashed or stretched too much, turn the big knob in the HORIZONTAL frame.
- If the trace runs around the screen, use the knob in the TRIGGER frame to move the green arrow on the right so that it’s between the top and the bottom of the trace.
- For an event that happens only once, for example a key press, use the MODE button to choose Single. The oscilloscope waits and stops as soon as the event happens.
- RUN/STOP freezes the picture, and S PIC saves it.
- At the end, take the probe off the circuit and switch the oscilloscope off.
Rules for working with the oscilloscope
- Never measure anything in a mains socket or on a device that plugs into one. Mains voltage (230 V) can kill, and our probes aren't even made for it.
- The ground clip goes only on GND. When we use both channels, both clips go on the same point, because the grounds are connected to each other inside the oscilloscope. Clips on two different points would make a short circuit through the oscilloscope.
- Power the oscilloscope only with its own adapter, not from a USB socket of the device you're measuring.
- With the probe on 1X, the voltage at the input may be at most 40 V peak to peak. Our circuits run on 3.3 V, 5 V or 12 V.
- Under the probe's cap there's a sharp needle. Don't point it at yourself or at others.
- Connect the generator output (GEN) only to an input, never to an Arduino output pin or to a power supply.
The oscilloscope in the Arduino workshop
We use the oscilloscope in these lessons:
- Voltage divider, Arduino and PWM: what the PWM signal on pin D9 looks like.
- Many switches on few pins: how the Arduino scans a keypad.
Reading the screen: PWM on pin D9
The screen picture above shows pin D9 with analogWrite(9, 128). In the picture below its squares are counted, and from them we can read everything about this signal:
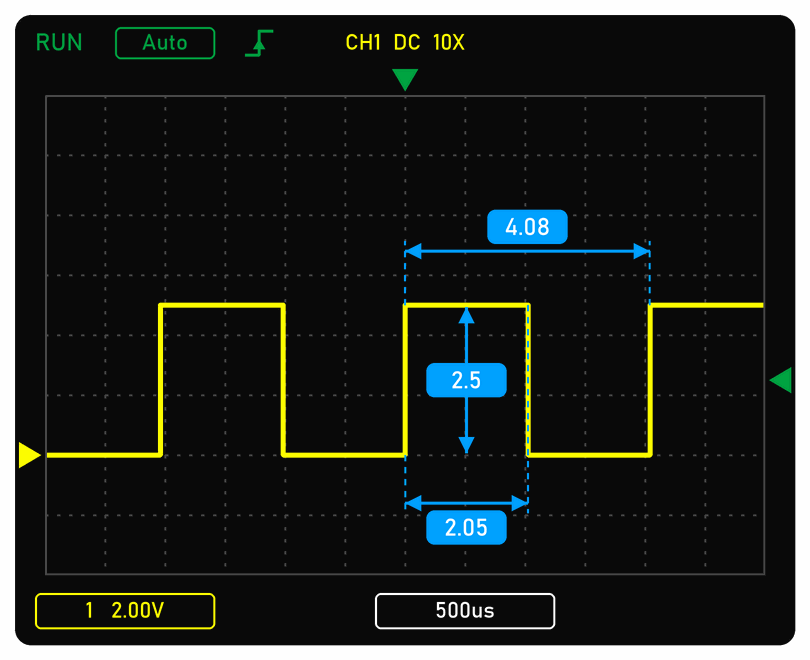
- Voltage: the top level is 2.5 squares above the zero arrow. At 2 V per square, that’s 5 V.
- Period: from one rising edge to the next there are 4.08 squares. At 500 µs per square, that’s 4.08 × 0.5 ms = 2.04 ms.
- Frequency: 1 / 2.04 ms ≈ 490 Hz, as in the Freq column. That’s the PWM frequency on pin D9 of an Arduino Uno.
- Duty cycle: the signal is high for 2.05 squares, about half the period, because 128 is about half of 255.
- Average: Vavg is 2.51 V, the same as a multimeter would show. A multimeter sees only the average, while the oscilloscope also shows the real shape of the signal (see misconception 11).
The trigger
The signal repeats, and the oscilloscope draws it again and again, many times a second. For the picture to stand still, every drawing must start at the same point of the signal. That’s what the trigger does: the oscilloscope waits for the voltage to cross the trigger level in the chosen direction, on the rising or the falling edge, and puts that moment where the trigger arrow is.
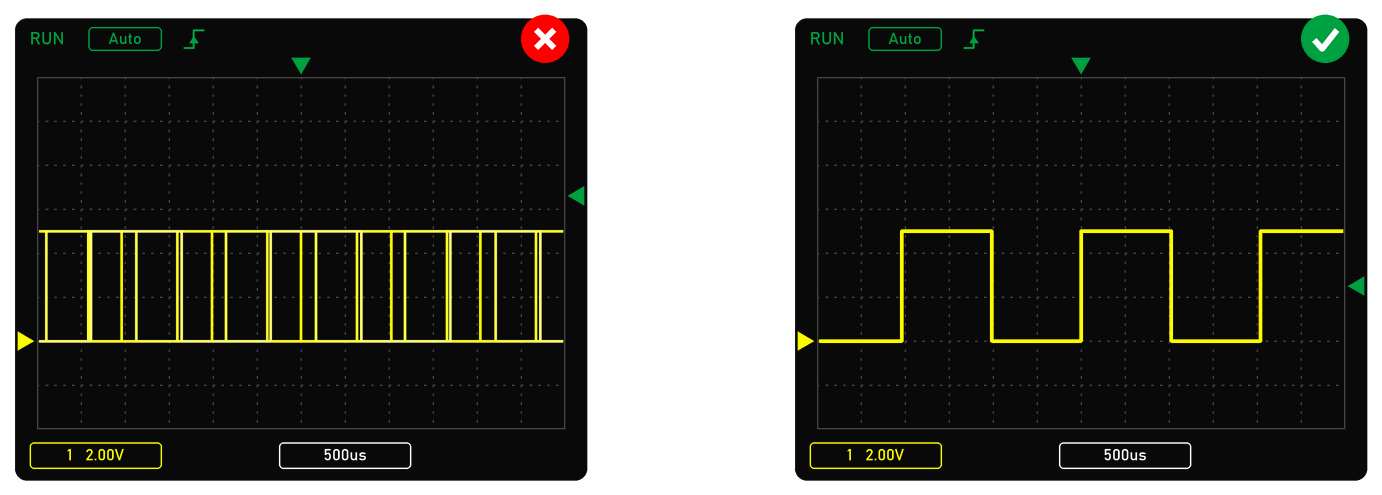
On the left, the trigger level is above the signal, so the voltage never crosses it. In Auto mode the oscilloscope then draws without a trigger: every drawing starts at a different point of the signal, the traces pile up and the picture runs. On the right, the level is between the top and the bottom, so the picture stands still.
- Auto draws even when there’s no trigger, so we always see something on the screen. It’s good for signals that repeat and for a steady voltage, for example a battery.
- Normal draws only when the trigger happens, and in between the last picture stays. It’s good for signals that don’t repeat regularly, for example the data an Arduino sends.
- Single waits for one trigger, draws it and stops. It’s good for an event that happens once, for example a key press or a hit of the ball.
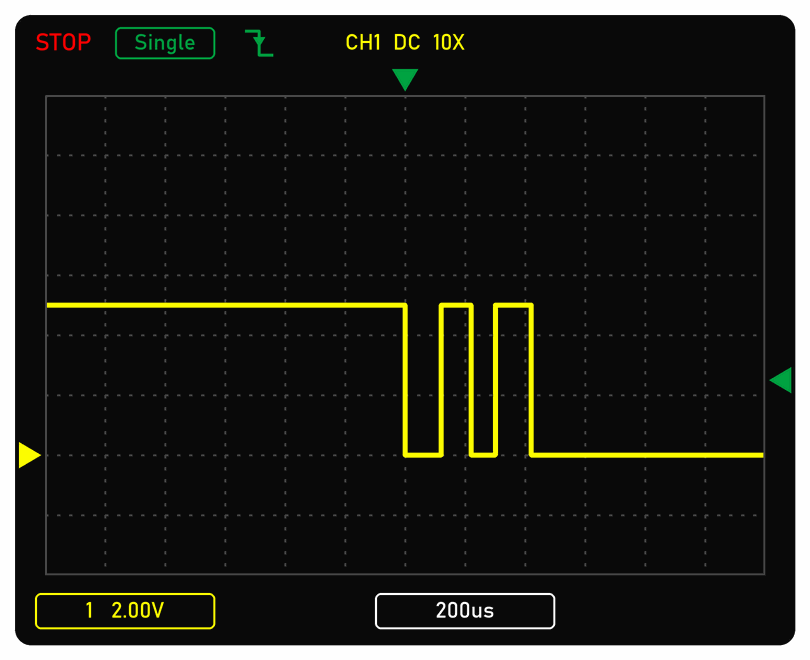
The picture shows an example: one press of a button, caught in Single mode on the falling edge. A pin with INPUT_PULLUP drops from 5 V to 0 V, but the button’s contacts bounce twice first, so the voltage goes back to 5 V twice. That’s contact bounce. The oscilloscope has stopped (STOP), so we can look at the picture calmly.
If the knob won’t move the trigger level, the automatic 50 % trigger is switched on in the menu (MENU). Switch it off.
Probe on 1X or on 10X?
The probe’s cable has a capacitance of 100 to 300 pF. On 1X, that capacitance is connected straight to the point we’re measuring: it weighs the circuit down and smothers fast signals, so the bandwidth drops to about 5 MHz. On 10X, the probe has a voltage divider that makes the signal ten times smaller, and it adds only 10 to 30 pF to the circuit. The bandwidth is then 100 MHz.
For Arduino signals 1X is enough too, but 10X shows fast edges better. That’s why we use 10X in the workshop. The setting in the oscilloscope (CONF) must be the same as the switch on the probe: if the probe is on 10X and the oscilloscope on 1X, a 9 V battery shows up as 0.9 V.
DC or AC?
In the channel’s settings (CONF) we also choose the coupling. DC shows the whole voltage, with the real zero. AC takes away the average and shows only the changes around it, so a battery on AC shows a flat line at zero. For Arduino signals we use DC. AC is useful when we’re looking for small changes on a large steady voltage, for example the ripple of the voltage after a rectifier (see Rectifiers and voltage regulators).
Cursors and measurements
With buttons F1 to F6 we choose up to six values that the oscilloscope measures by itself, for example the frequency, the highest voltage or the average. H CUR switches on two vertical lines: you move them to two points of the trace, and the oscilloscope shows the time between them. V CUR does the same with voltage, with two horizontal lines.
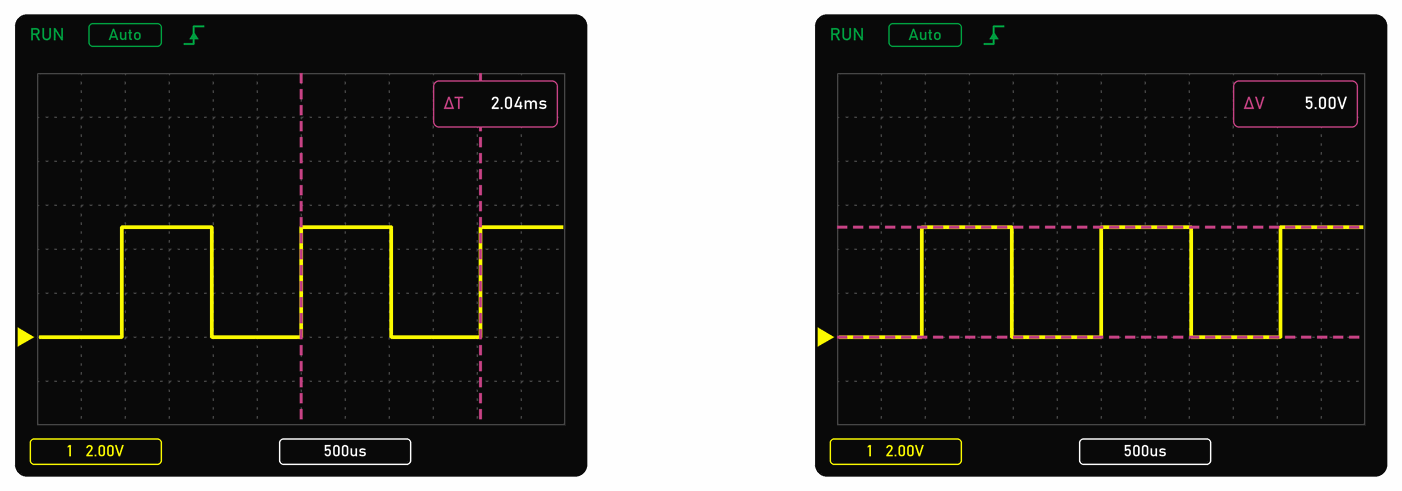
On the left, the time cursors are on two neighbouring rising edges of the signal from pin D9: the distance is 2.04 ms, one period. On the right, the voltage cursors are at the bottom and the top of the signal: the difference is 5 V.
The measurements are correct only when at least one whole period of the signal is on the screen and the trace doesn’t go above or below the screen. If the frequency is 0, choose the Auto trigger and press AUTO.
The signal generator
The oscilloscope also has a signal generator: at the GEN output it gives one of 14 waveforms, for example a sine or a square wave, up to 2.5 V peak to peak. We choose the frequency in steps of 1 Hz, and for a square wave also the duty cycle, from 1 to 99 %. The leader can connect it to the CH2 input and show what different waveforms look like.
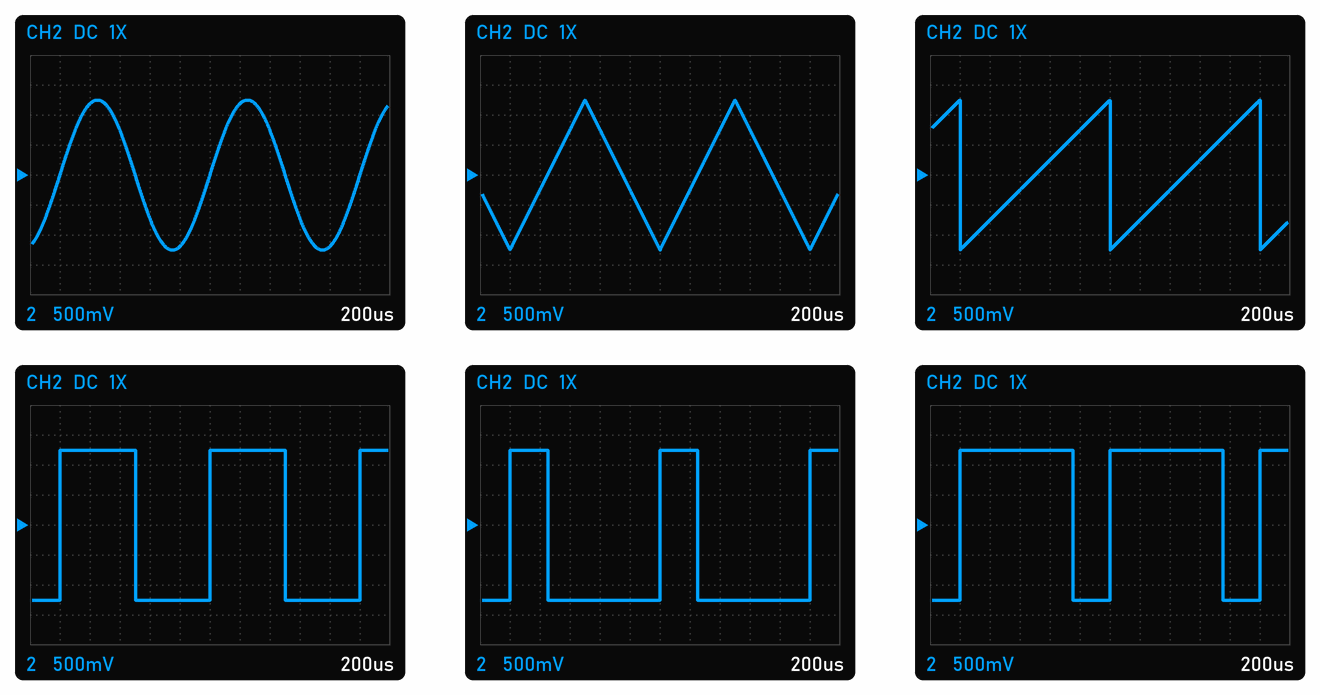
The picture shows the GEN output connected to the CH2 input, with a signal of 1 kHz and 2.5 V peak to peak. In the top row there’s a sine, a triangle and a sawtooth wave, and in the bottom row a square wave with a duty cycle of 50 %, 25 % and 75 %. At 200 µs per division one period takes 5 squares, and at 500 mV per division the signal is 5 squares tall. The channel is on DC coupling, so we see the real voltage: the signal goes from −1.25 V to +1.25 V, as far below zero as above it. The duty cycle of a square wave changes only how long the signal is high, not how high it is.
Can the Arduino be an oscilloscope?
In Exercise 3 of lesson 2.1, the Arduino measured a voltage itself, with pin A1. One measurement with analogRead() takes about a tenth of a millisecond, so the Arduino measures the voltage about 10,000 times a second. Our oscilloscope does it a billion times a second, a hundred thousand times faster. That’s why the Arduino can’t see the shape of the PWM signal, and the oscilloscope can.
 What did we learn?
- An oscilloscope draws voltage over time: time goes from left to right, and voltage up and down.
- Volts per division and time per division tell us what one square is worth.
- The ground clip goes only on GND. When we use two probes, both clips go on the same point.
- The switch on the probe and the setting in the oscilloscope must be the same, 1X or 10X.
- The trigger keeps the picture still, and Single mode catches an event that happens only once.
- AUTO sets up the oscilloscope by itself, so it’s a good first step.
Quick quiz
1. A multimeter on a PWM pin shows 2.5 V. What does an oscilloscope show?
2. The oscilloscope is on 2 V per division, and the trace is 3 squares above the zero arrow. What is the voltage?
3. The oscilloscope is on 1 ms per division, and the signal repeats every 5 squares. What is its frequency?
4. Why must the ground clips of both probes be on the same point?
5. The switch on the probe is on 10X, but the oscilloscope is set to 1X. What does the oscilloscope show for a 9 V battery?
6. Which trigger mode do you choose to catch a single key press?